We Are Tomodachi Autumn 2015
27/40
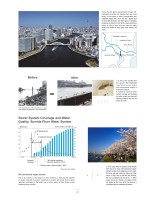
2743During the Edo period (seventeenth through mid-nineteenth centuries), the Sumida River was a key artery in the system of water transportation that supported people’s lives, and it was also a popular spot for boat rides, fireworks, and other types of recreation, serving as the theme for color prints, songs, and literary works. In today’s Tokyo, this river has once again become the habitat for many types of fish, insects, and plants.3. In the early 1960s the pollution of the Sumida River was at its worst, with biochemical oxygen demand as high as 63 milligrams per liter (mg/l). But since the mid-1980s the figure has been below 10 mg/l. And as pollution has declined, the river’s popularity has recovered. 4. Water buses now ply the Sumida, and regular events are staged on the river, which has become a recreational spot for residents and visitors.BOD is an indicator of the degree of water pollution. It indicates the quantity of oxygen required by aerobic organisms to oxidize and break down organic materials (pollutants) in the water over a certain period of time. Higher values indicate greater pollution. BOD (biochemical oxygen demand)BeforeAfter1. A view of the Sumida River from around 1967: Wastewater from factories and homes had caused water quality to deteriorate sharply. 2. Thanks to improved sewer system coverage and dredging, the water quality has improved, allowing seagulls and fish like gobies to return.12BOD (mg/l)Sewer system coverage (%)At Mikawashima At Odaibashi Bridge*01020304050607061020304050607080901001950Purifying water inflows started (1964)TMG adopts mandatoryemission standards (1970)1995 (FY)1967Intensive dredging1958Tone RiverArakawa RiverSumida RiverTokyo Skytree®Musashi channelSewer System Coverage and Water Quality, Sumida River Water System *Observation point changed.1961From Annual Report on the Environment in Japan, 1982: Abridged and Illustrated for Easy Understanding.
元のページ